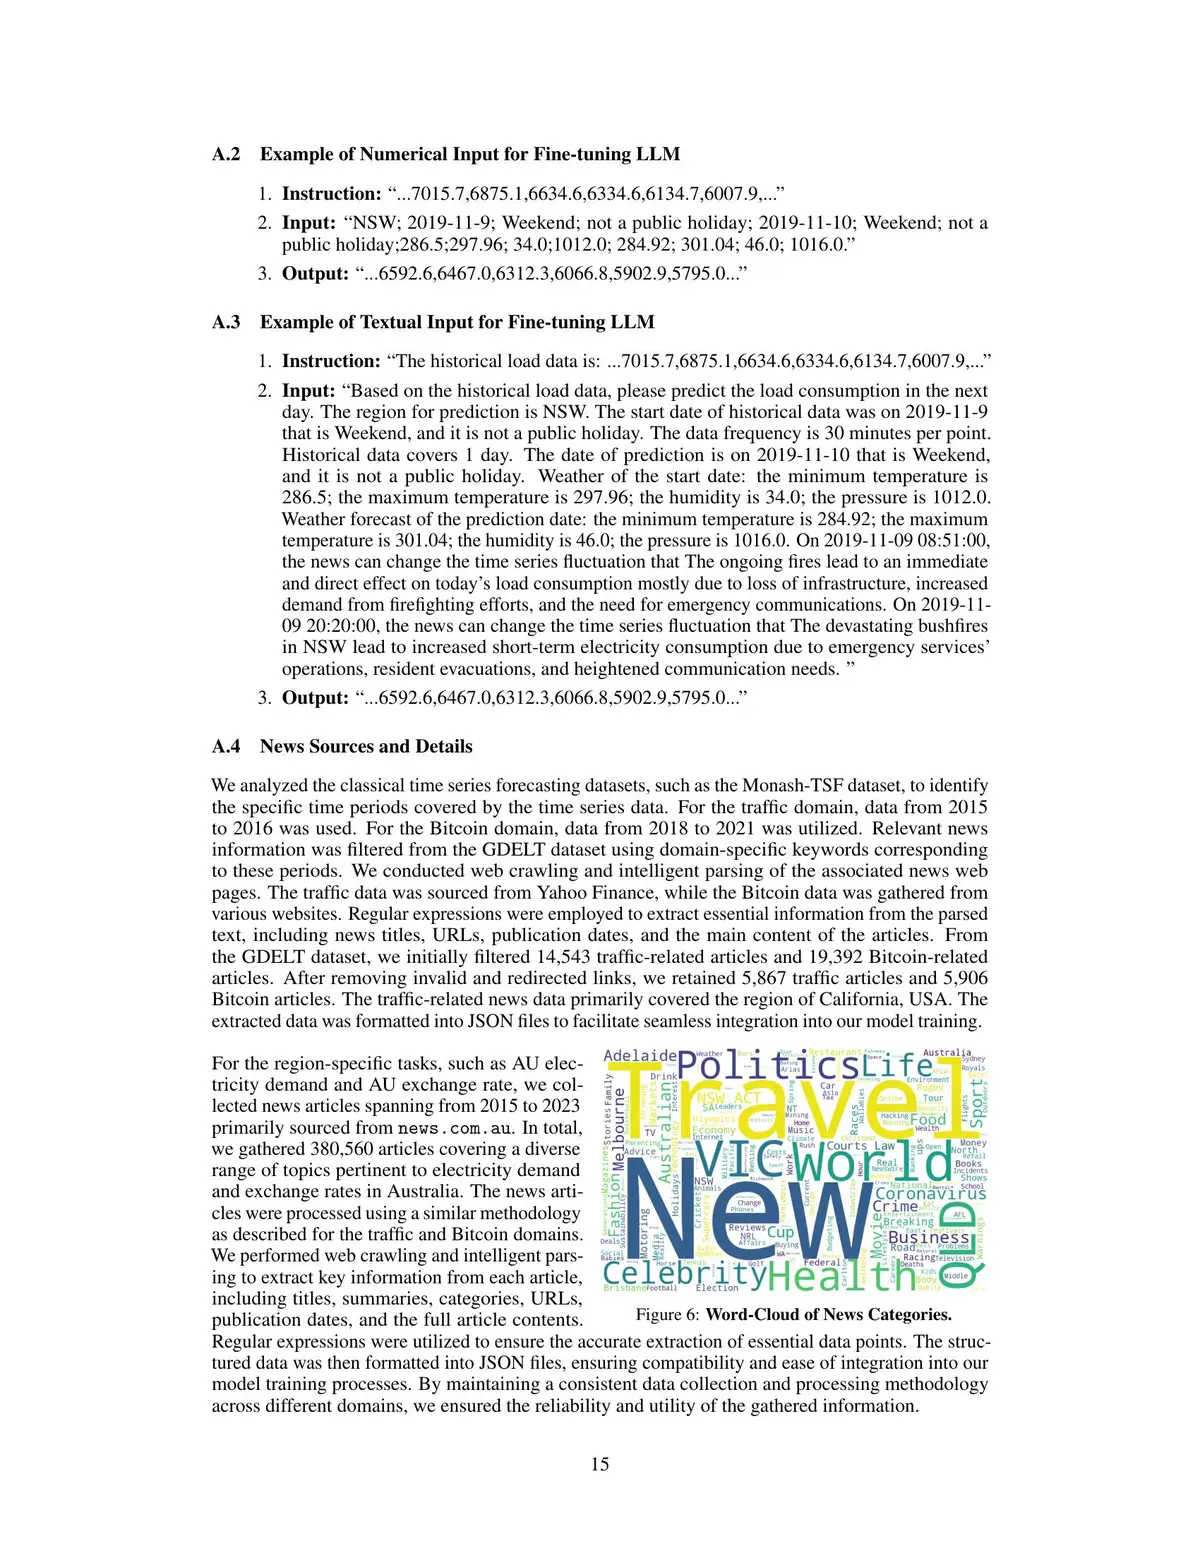
====================================================
Time series analysis is a cornerstone of modern trading, allowing traders to identify trends, predict future prices, and make data-driven decisions. As markets evolve, forecasting becomes an increasingly important skill for traders, especially those using quantitative methods and algorithmic strategies. In this comprehensive guide, we will explore how to forecast with time series analysis in trading, covering methods, tools, and best practices that can significantly improve trading strategies.
What is Time Series Analysis in Trading?
Time series analysis involves analyzing data points collected or recorded at successive, equally spaced intervals over time. In trading, this often means looking at historical prices, volumes, or other market variables, and using that data to forecast future values.
Key Components of Time Series Data:
- Trend: The long-term movement in the data.
- Seasonality: Regular patterns that repeat over specific time intervals (e.g., monthly, quarterly).
- Noise: Irregular fluctuations in the data that do not follow any predictable pattern.
- Cyclic Patterns: Fluctuations in the data related to business cycles or economic conditions that don’t occur at fixed periods.
Time series forecasting can help traders anticipate price movements, manage risk, and optimize trading strategies.
Why Time Series Analysis Matters in Trading
The ability to forecast price movements using time series analysis gives traders a significant edge. By understanding historical patterns, traders can make more informed decisions, minimize risk, and maximize potential returns.
Benefits of Time Series Forecasting in Trading:
- Predicting Price Trends: Time series models help traders forecast price movements, which is crucial for both short-term and long-term trading strategies.
- Improved Risk Management: Forecasting helps traders anticipate periods of high volatility, allowing them to hedge their positions or adjust their strategy.
- Optimization of Trading Strategies: By using past data effectively, traders can refine their strategies and identify the most profitable opportunities.
Methods of Time Series Forecasting for Traders
There are several methods that traders use for time series forecasting. These methods can be broadly classified into two categories: statistical models and machine learning models.
1. Autoregressive Integrated Moving Average (ARIMA)
ARIMA is one of the most popular statistical models for time series forecasting. It combines autoregression (AR), differencing (I), and moving averages (MA) to model data.
How ARIMA Works:
- Autoregression (AR): This part of the model uses the relationship between an observation and several lagged observations (previous time steps).
- Differencing (I): This is the process of subtracting an observation from a previous observation to make the data stationary (i.e., constant mean and variance).
- Moving Average (MA): The model uses the relationship between an observation and a residual error from a moving average model applied to lagged observations.
Advantages:
- Widely used and well-documented.
- Effective for stationary data with linear patterns.
Disadvantages:
- Does not work well with non-linear or highly volatile markets.
- Requires the data to be stationary, which may not always be the case in real-world financial markets.
2. Exponential Smoothing (ETS)
Exponential smoothing methods use weighted averages of past observations, where more recent observations are given more weight. This method is especially useful when forecasting trends with clear seasonality.
Types of Exponential Smoothing:
- Simple Exponential Smoothing: Best for data without trend or seasonality.
- Holt’s Linear Trend Model: Useful when there’s a linear trend but no seasonality.
- Holt-Winters Seasonal Model: Best for time series with both trend and seasonality.
Advantages:
- Effective for time series with clear seasonal patterns.
- Easy to implement and computationally efficient.
Disadvantages:
- Less effective for highly volatile or irregular data.
- Cannot capture long-term trends as accurately as ARIMA in some cases.
3. Machine Learning Models
In addition to traditional statistical models, many traders are turning to machine learning (ML) for time series forecasting, particularly for more complex patterns and large datasets.
Popular Machine Learning Techniques:
- Random Forests: An ensemble learning method that can handle both regression and classification tasks, making it effective for time series data.
- Support Vector Machines (SVM): A powerful algorithm that can identify complex relationships within data.
- Neural Networks: Deep learning models, especially recurrent neural networks (RNNs) and long short-term memory (LSTM) networks, are used for their ability to process sequential data and capture long-term dependencies.
Advantages:
- Can model complex, non-linear relationships.
- Works well with large datasets and unstructured data like news sentiment or social media analysis.
Disadvantages:
- Computationally expensive.
- Requires significant data preprocessing and tuning.
- Can lead to overfitting if not carefully managed.
How to Optimize Time Series Models for Trading
To maximize the effectiveness of time series forecasting in trading, it’s essential to optimize your models. Here are some techniques and best practices for fine-tuning your forecasts:
1. Data Preprocessing
Before applying any time series model, it’s crucial to preprocess your data. This involves cleaning the data, handling missing values, and transforming variables if needed.
- Stationarity Testing: For ARIMA and other models, you need to test whether the data is stationary. You can use tests like the Augmented Dickey-Fuller (ADF) test to check for stationarity.
- Differencing: If your data is not stationary, apply differencing to remove trends and make the data more suitable for modeling.
2. Hyperparameter Tuning
For both ARIMA and machine learning models, hyperparameter tuning is essential. Use techniques like grid search or random search to find the optimal set of parameters that minimize forecasting error.
- ARIMA Tuning: Focus on tuning the p, d, and q parameters for the ARIMA model.
- Machine Learning Tuning: Focus on hyperparameters like the number of trees in a random forest or the number of layers in a neural network.
3. Cross-Validation
To ensure that your model generalizes well to unseen data, perform cross-validation. In time series analysis, this typically involves time-based cross-validation, where training and test sets are split in a way that respects the chronological order of the data.
Real-World Application: Using Time Series Forecasting for Trading Strategy
Once your model is optimized, it’s time to integrate it into your trading strategy. Here’s how you can use time series forecasting to create a trading plan:
- Price Prediction: Use your time series model to predict future price movements based on past data.
- Risk Management: Forecasting volatility using time series analysis can help set stop-loss and take-profit levels, minimizing risk.
- Entry and Exit Points: By predicting price movements, you can fine-tune your entry and exit points, improving your trade timing.
- Portfolio Optimization: Use time series forecasts for multiple assets to build a diversified portfolio that optimizes returns based on future predictions.
Frequently Asked Questions (FAQ)
1. How can I validate time series models in trading?
Validation involves checking the model’s predictive power on out-of-sample data. You can use techniques like cross-validation or a hold-out sample, comparing predicted values with actual outcomes. Metrics like Mean Squared Error (MSE) or Mean Absolute Percentage Error (MAPE) can help assess model performance.
2. What are the best time series models for predicting stock prices?
For stock prices, ARIMA and Holt-Winters are great starting points, especially if the data shows a trend or seasonality. However, for non-linear relationships, machine learning models like Random Forests or LSTM networks can be more effective.
3. How do I handle seasonality in time series analysis?
If your data exhibits seasonality, using models like Holt-Winters or incorporating Fourier series into machine learning models can capture the cyclical patterns. For ARIMA, you can include seasonal differencing to account for periodic fluctuations.
Conclusion
Time series analysis is a powerful tool for traders, providing a structured approach to forecasting price movements and optimizing strategies. By understanding the different methods, optimizing your models, and applying them effectively in real-world trading scenarios, you can significantly enhance your decision-making process. Whether you are a beginner or an experienced trader, mastering time series forecasting can help you navigate the complexities of the market with greater confidence.
If you found this article helpful, feel free to share it with fellow traders or leave a comment with your thoughts or questions!