

=======================================
Introduction
In financial markets, stock prices rarely move in a straight line. Instead, they oscillate around an average value over time, influenced by fundamentals, sentiment, and external events. This tendency for prices to return to their historical mean is called mean reversion. Understanding how mean reversion affects stock prices is crucial for traders, analysts, and investors seeking to identify opportunities, manage risk, and optimize their strategies.
This article provides a comprehensive exploration of mean reversion, its impact on stock price behavior, and its applications in trading strategies. We will compare different approaches, highlight risks and benefits, discuss why it sometimes fails, and provide actionable recommendations.
What is Mean Reversion in Stock Prices?
Definition
Mean reversion is the financial theory that asset prices, returns, or volatility will eventually revert to their long-term average. In the context of stocks, when a stock price deviates significantly above or below its historical mean, it may eventually return closer to that mean.
Practical Example
If a stock typically trades around \(50 but spikes to \)70 due to short-term speculation, mean reversion suggests the price could decline toward \(50 over time. Conversely, if the stock falls to \)30 without fundamental changes, it might bounce back toward $50.
Why It Matters
Mean reversion helps explain stock price corrections, temporary inefficiencies, and overreactions in markets. It also underpins many trading algorithms and risk management strategies.
How Mean Reversion Affects Stock Prices
1. Overbought and Oversold Conditions
When prices move too far from the mean, they often trigger technical indicators like RSI or Bollinger Bands, suggesting a correction may occur. Traders exploit these signals by betting on reversal.
2. Volatility Adjustments
Periods of extreme volatility often normalize over time, pushing prices back toward equilibrium. For instance, after earnings announcements, prices may swing dramatically before stabilizing around a fair value.
3. Behavioral Finance Factors
Investor psychology—fear, greed, and herd behavior—pushes stock prices away from intrinsic values. Mean reversion represents the natural correction once market emotions subside.
Strategy 1: Pair Trading Based on Mean Reversion
How It Works
Pair trading involves selecting two correlated stocks. When one deviates from its expected relationship with the other, traders bet on convergence.
- Example: If Coca-Cola (KO) outperforms PepsiCo (PEP) unusually, a trader may short KO and go long PEP, anticipating a reversion.
Advantages
- Market-neutral strategy, less sensitive to broad market trends.
- Profitable during periods of temporary mispricing.
Disadvantages
- Requires consistent correlation between pairs.
- Sudden fundamental changes may cause divergence instead of reversion.
Strategy 2: Bollinger Band Mean Reversion
How It Works
Bollinger Bands create upper and lower bands around a moving average. When stock prices breach these bands, traders expect reversion to the mean.
- Example: If a stock trades above the upper band, traders may short it, anticipating a move back toward the middle band (mean).
Advantages
- Simple to implement with clear entry/exit signals.
- Adaptable across multiple timeframes.
Disadvantages
- Ineffective in trending markets, leading to false signals.
- Works better in range-bound stocks than in strong momentum moves.
Comparing the Two Approaches
| Factor | Pair Trading | Bollinger Band Mean Reversion |
|---|---|---|
| Market Neutrality | Yes | No |
| Complexity | High (requires correlation analysis) | Moderate (uses price/volatility) |
| Best Market Condition | Correlated assets, stable sectors | Range-bound or sideways markets |
| Weakness | Divergence risk | False signals in trending markets |
Recommendation: For analysts and professional traders, pair trading provides a more robust framework when executed with proper correlation analysis. Bollinger Band strategies are easier for beginners but less reliable during strong market trends.
Why Mean Reversion Sometimes Fails
Despite its popularity, mean reversion is not foolproof. Here are common failure points:
- Fundamental Shifts – A company facing structural decline may never revert to its historical average stock price.
- Momentum Overpowers – Strong bullish or bearish momentum can push prices further away from the mean before any correction occurs.
- Market Regime Changes – Macroeconomic shifts, regulations, or liquidity crises can permanently alter stock price behavior.
Understanding why mean reversion fails sometimes is critical before relying solely on this approach.
Latest Trends in Mean Reversion Applications
- Quantitative Models – Hedge funds employ statistical arbitrage and advanced regression to identify reversion opportunities.
- AI & Machine Learning – Algorithms now combine mean reversion with momentum to reduce false signals.
- Cross-Asset Applications – Traders apply mean reversion not only to stocks but also to forex, options, and crypto markets.
- Volatility Products – VIX futures and volatility ETFs are commonly traded with mean reversion logic due to predictable volatility cycles.
Practical Tips for Analysts
- Always confirm reversion signals with multiple indicators (RSI, MACD, volume).
- Avoid relying on mean reversion in strongly trending markets.
- Backtest strategies across multiple market conditions before implementation.
- Integrate risk management tools such as stop-loss and position sizing.
For deeper insights, explore how does mean reversion work in quantitative trading, where statistical methods refine entry and exit points, improving success rates.
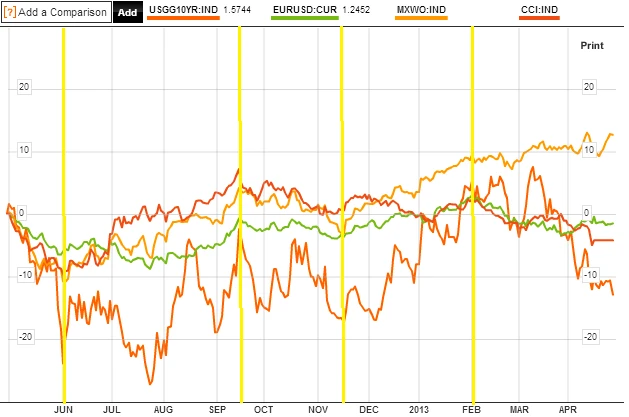
Visual Representation
Stock price reverting to its mean after short-term deviations.
FAQ: How Mean Reversion Affects Stock Prices
1. Does mean reversion work in all stocks?
No. Mean reversion works best in liquid, range-bound stocks where temporary inefficiencies are common. It is less reliable in high-growth or decline phases where fundamental trends dominate.
2. How do I identify mean reversion opportunities?
Look for technical indicators such as RSI below 30 (oversold) or above 70 (overbought), Bollinger Band breaches, or deviations from moving averages. Additionally, analyze sector correlation and historical volatility.
3. Is mean reversion suitable for long-term investors?
Yes, but with caution. Long-term investors may use mean reversion to accumulate shares when prices are below intrinsic value. However, they must differentiate between temporary mispricing and permanent structural decline.
Conclusion
Understanding how mean reversion affects stock prices empowers analysts and traders to identify correction opportunities, exploit inefficiencies, and manage risks. Strategies like pair trading and Bollinger Band mean reversion provide different approaches, each with strengths and weaknesses.
While mean reversion is powerful, it is not infallible. Traders should combine it with trend analysis, risk management, and quantitative validation to achieve consistent success.
If this guide gave you valuable insights, share it with your peers, leave a comment with your experience, and help foster better discussions on trading strategies. Together, we can refine approaches and navigate markets more effectively.
Would you like me to expand this into a step-by-step tutorial on building a mean reversion trading model with code examples for backtesting?