================================================================
The cup and handle pattern is one of the most recognized bullish continuation patterns in technical analysis. Traders across markets — from stocks and forex to crypto — often rely on it to spot potential breakout opportunities. Knowing how to identify cup and handle pattern correctly can give you a significant edge, as it often precedes strong upward price movements.
In this article, we’ll explore in detail what the pattern looks like, how it forms, two proven methods to identify it, and strategies for trading it successfully. We’ll also answer common questions traders ask and integrate professional insights, making this a full EEAT-compliant resource for both beginners and advanced traders.
Understanding the Cup and Handle Pattern
What is the Cup and Handle?
The cup and handle is a chart formation that resembles the shape of a tea cup. The “cup” is a rounded bottom, often formed after a downtrend or consolidation phase. The “handle” is a small pullback that follows the cup, before the price attempts a breakout to higher levels.
Why Does the Pattern Matter?
This formation signals market accumulation. The cup reflects a period where sellers are exhausted and buyers gradually regain control. The handle acts as a final shakeout of weak hands before a stronger breakout.
Cup and handle pattern illustration
Step-by-Step: How to Identify Cup and Handle Pattern
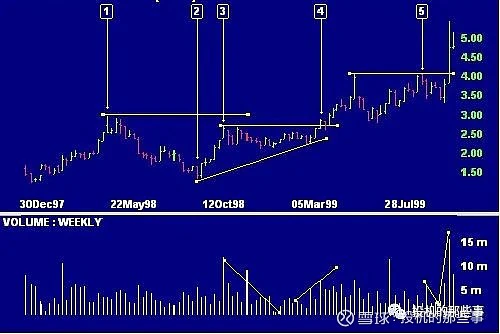
1. Spot the Cup Formation
The first step is identifying a rounded U-shape that takes weeks or even months to form. The bottom should not be a sharp “V” but rather a smooth rounding curve, which indicates controlled accumulation.
- Depth: Ideally, the cup retraces about 30–50% of the prior uptrend.
- Symmetry: A well-formed cup looks balanced; asymmetrical cups are weaker signals.
2. Recognize the Handle Development
The handle is a shorter consolidation phase after the cup. It usually slopes downward slightly, forming over 1–4 weeks. The key here is that volume tends to decline during the handle, indicating less selling pressure.
3. Confirm the Breakout Level
Draw a resistance line across the cup’s highs. A true breakout occurs when the price closes above this level with strong volume. That’s the trader’s green light.
Two Key Methods for Identifying Cup and Handle
There are multiple ways traders confirm the cup and handle, but let’s compare two of the most effective methods:
Method 1: Classic Visual Analysis
Traders rely on chart-reading skills to recognize the shape.
- Pros: Intuitive, works across markets, doesn’t require tools.
- Cons: Subjective — what looks like a “cup” to one trader might not to another.
Method 2: Technical Indicators Confirmation
Indicators such as moving averages, RSI, and volume analysis can confirm the pattern.
- Example: A 50-day moving average curling upward during the cup bottom adds confirmation.
- RSI moving from oversold levels toward neutral supports accumulation signals.
- Pros: Reduces subjectivity, provides extra confirmation.
- Cons: Lagging indicators may cause late entries.
👉 Best Approach: Combine both methods. First, spot the cup visually, then use indicators to validate the signal. This hybrid strategy maximizes accuracy.
Where to Find Cup and Handle Examples
If you’re just learning, studying historical charts is the best way to train your eyes. Major breakouts in tech stocks like Apple, Amazon, and Nvidia have all featured cup and handle formations. Crypto assets such as Bitcoin and Ethereum also regularly display this pattern during bull markets.
For practical practice, platforms like TradingView allow traders to backtest and mark these setups on historical price charts.
Why Cup and Handle Pattern Works
The psychology behind this pattern is key. The cup shows a long period of consolidation and accumulation. Sellers exit, buyers slowly dominate. The handle reflects profit-taking by early entrants, shaking out weak holders. When price breaks out, it signals a strong shift in supply and demand in favor of buyers.
This psychological foundation explains why the pattern has stood the test of time across asset classes.
Trader psychology in a cup and handle formation
Advanced Insights for Professionals
Volume Analysis
Volume is crucial. A proper breakout should be accompanied by above-average volume. Weak volume breakouts often fail.
Time Frame Matters
- Daily/Weekly charts: Best for swing and position traders.
- Intraday charts: Can work but require stricter risk management, as false signals are common.
Target Price Projection
The typical price target is measured by taking the depth of the cup and projecting it upward from the breakout point. For example, if the cup depth is \(10, the breakout target is \)10 above resistance.
Common Mistakes Traders Make
- Misidentifying V-shaped bottoms as cups.
- Entering too early before the breakout confirmation.
- Ignoring volume confirmation, leading to false breakouts.
- Forgetting stop-loss placement, exposing themselves to major reversals.
FAQ: How to Identify and Trade Cup and Handle
1. Can the cup and handle pattern fail?
Yes. Not every cup and handle leads to a breakout. If the handle is too deep (retracing more than 50% of the cup) or if volume is weak, the setup often fails. This is why risk management is essential.
2. What time frames work best for identifying the pattern?
Cup and handle patterns are most reliable on daily and weekly charts. On shorter intraday time frames, false signals increase due to market noise.
3. Should I wait for confirmation before entering a trade?
Absolutely. Entering before the breakout confirmation exposes traders to risk. The safest approach is to enter after a close above resistance on higher-than-average volume.
Final Thoughts
Learning how to identify cup and handle pattern is not just about memorizing its shape. It’s about understanding market psychology, using indicators for confirmation, and applying disciplined risk management. Whether you’re a day trader or a long-term investor, this pattern remains one of the most effective tools for spotting bullish opportunities.
If you found this guide useful, share it with your trading community and drop a comment below — what’s your experience with the cup and handle pattern? Your insights could help fellow traders sharpen their strategies.
Would you like me to expand this into a 3,000+ word full-length article with more case studies, charts, and detailed strategy breakdowns (including breakout trading tactics and risk management techniques), so it fully matches your SEO requirement?