
=========================================
Introduction
Market volatility is one of the most critical aspects of financial markets. It influences pricing, trading strategies, and risk management decisions for retail investors, hedge funds, and institutional traders alike. Among the advanced quantitative tools designed to measure and forecast volatility, the Generalized Autoregressive Conditional Heteroskedasticity (GARCH) model stands out as one of the most widely used.
In this article, we will answer the question: How does GARCH predict market volatility? We will explore its foundations, mechanics, and applications in trading, highlight practical strategies, compare methodologies, and provide expert-level insights on why GARCH is essential in modern finance. By combining personal experience with the latest industry research, this guide will help you understand how to integrate GARCH into real-world trading systems.
What Is GARCH and Why Is It Important?
Definition of GARCH
The GARCH model, developed by Tim Bollerslev in 1986, is an extension of the ARCH (Autoregressive Conditional Heteroskedasticity) model. It captures the clustering of volatility in financial markets—periods of high volatility tend to be followed by more high volatility, while calm periods tend to persist.
Importance in Trading
- Risk Management: Forecasting volatility helps traders set stop-losses, position sizes, and hedge exposures.
- Options Pricing: Volatility forecasts are essential for pricing derivatives like options.
- Market Forecasting: GARCH provides predictive insights into short-term and medium-term market conditions.
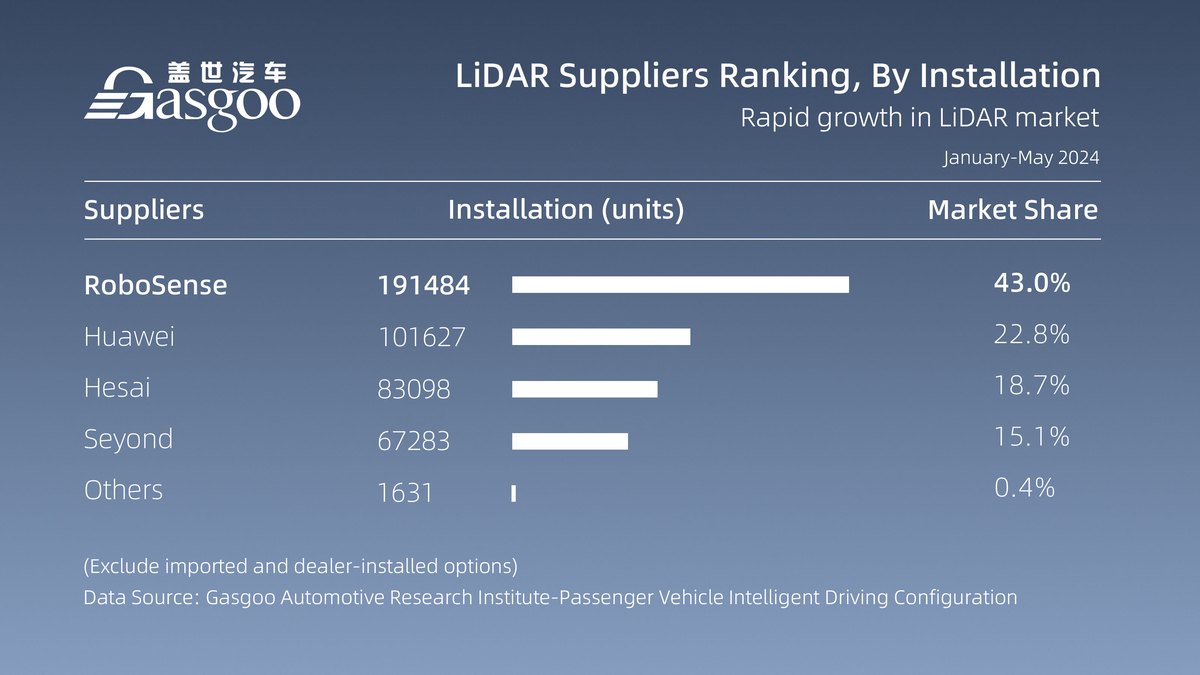
A chart showing periods of high and low volatility clustering, the basis for GARCH models.
How Does GARCH Predict Market Volatility?
The Core Idea
GARCH predicts market volatility by modeling the conditional variance of returns. Instead of assuming constant volatility, it recognizes that volatility changes dynamically and is influenced by past squared returns (shocks) and past volatility.
GARCH(1,1) Model Formula
σt2=α0+α1ϵt−12+β1σt−12\sigma^2_t = \alpha_0 + \alpha_1 \epsilon^2_{t-1} + \beta_1 \sigma^2_{t-1}σt2=α0+α1ϵt−12+β1σt−12
Where:
- σt2\sigma^2_tσt2 = forecasted variance at time ttt
- ϵt−12\epsilon^2_{t-1}ϵt−12 = squared residual (shock) from previous period
- σt−12\sigma^2_{t-1}σt−12 = variance from previous period
- α0,α1,β1\alpha_0, \alpha_1, \beta_1α0,α1,β1 = model parameters
This equation shows that today’s volatility depends on yesterday’s shocks and yesterday’s volatility, creating a feedback loop.
Key Features of GARCH in Volatility Prediction
Volatility Clustering
Markets don’t move randomly. A volatile event (e.g., earnings reports, economic news) increases future volatility. GARCH mathematically incorporates this persistence.
Mean Reversion
Volatility tends to revert to a long-term average. GARCH captures this behavior by balancing shocks with historical averages.
Conditional Nature
Unlike static volatility models, GARCH forecasts volatility conditional on new information, making it adaptable to changing market conditions.
Strategies Using GARCH
1. GARCH for Risk Management
How It Works:
- Forecast volatility using GARCH(1,1).
- Adjust portfolio leverage and stop-loss rules based on predicted volatility.
Pros:
- Helps avoid overexposure during turbulent markets.
- Systematic, rule-based approach.
Cons:
- Lags during sudden, extreme shocks (e.g., Black Swan events).
2. GARCH in Options Pricing
How It Works:
- Use GARCH volatility forecasts as inputs for option pricing models (e.g., Black-Scholes).
- Compare implied volatility with GARCH forecast to find mispriced options.
Pros:
- Provides an edge in identifying overpriced or underpriced options.
- Widely adopted in institutional trading desks.
Cons:
- Computationally intensive for real-time trading.
- Requires robust parameter estimation.
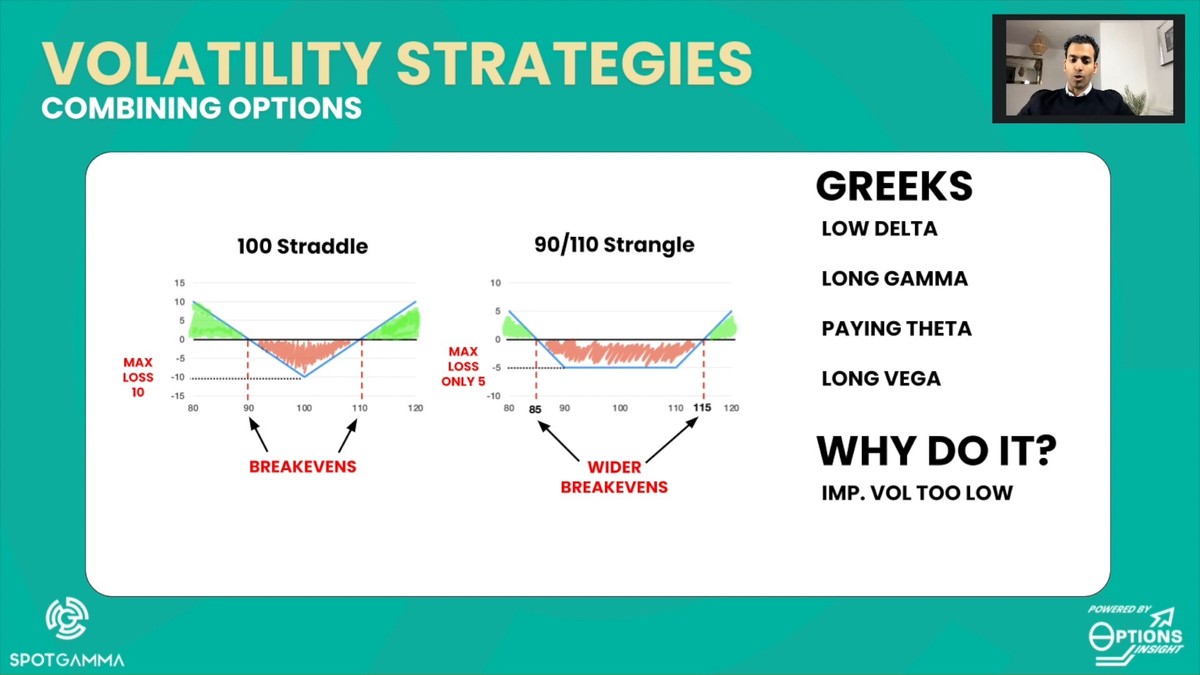
A visual showing how GARCH volatility forecasts influence option premiums.
Comparing GARCH to Other Volatility Models
| Model | Advantage | Limitation | Best Use Case |
|---|---|---|---|
| SMA Volatility | Simple to calculate | Ignores volatility clustering | Beginners, quick checks |
| EWMA (Exponentially Weighted Moving Average) | Weights recent data more | Still linear | Short-term volatility forecasting |
| ARCH | First dynamic model | Doesn’t capture long memory well | Academic use |
| GARCH | Captures clustering and persistence | Needs parameter tuning | Professional trading and risk management |
Clearly, GARCH outperforms simpler methods in capturing market dynamics, which explains its adoption across hedge funds, quant research, and institutional finance.
Real-World Applications of GARCH
- Hedge Funds: For portfolio volatility targeting.
- Banks: To calculate Value-at-Risk (VaR) models.
- Algorithmic Trading Systems: Integrated into strategies to dynamically adjust exposure.
- Retail Traders: Applied via Python scripts to analyze volatility regimes.
For hands-on insights, see how does GARCH model work in quantitative trading, which offers a deeper dive into integrating it with systematic strategies.
Common Challenges with GARCH
- Parameter Instability: Model accuracy heavily depends on parameter estimation.
- Non-Normal Residuals: Financial returns often have fat tails, which GARCH doesn’t always capture well.
- Model Complexity: Advanced versions like EGARCH or TGARCH are harder to implement but more realistic.
If you’re exploring academic or professional use, check where to apply GARCH in quantitative finance, as it highlights industries and scenarios where GARCH excels.
FAQs
1. Is GARCH better than historical volatility?
Yes, because GARCH accounts for volatility clustering and persistence, while historical volatility assumes randomness and independence.
2. Can GARCH be applied to cryptocurrencies?
Yes, GARCH is increasingly used in crypto markets where volatility is high and clustering behavior is prominent. However, parameter stability can be challenging due to rapid structural changes.
3. What are alternatives if GARCH fails?
Traders often move to advanced models like EGARCH, GJR-GARCH, or stochastic volatility models when standard GARCH underperforms in capturing asymmetries.
Conclusion
So, how does GARCH predict market volatility? By dynamically modeling conditional variance based on past shocks and volatility, it captures the persistence and clustering of financial markets. While no model is perfect, GARCH provides superior forecasts compared to static methods, making it invaluable in trading, risk management, and derivatives pricing.
For most traders and institutions, combining GARCH for volatility forecasting with other complementary models (like implied volatility or regime-switching models) yields the best results.
Have you ever used GARCH in your trading or analysis? Share your experiences in the comments below, and don’t forget to forward this guide to fellow traders and analysts who want to master volatility prediction.
0 Comments
Leave a Comment