Time series analysis has become an indispensable tool in modern finance and algorithmic trading. For beginners, understanding how to analyze financial data over time is the first step toward building systematic and profitable trading strategies. This novice guide to time series analysis in trading explains the fundamental concepts, practical applications, and proven strategies for traders who want to use time series methods to improve decision-making.
What Is Time Series Analysis in Trading?
Definition
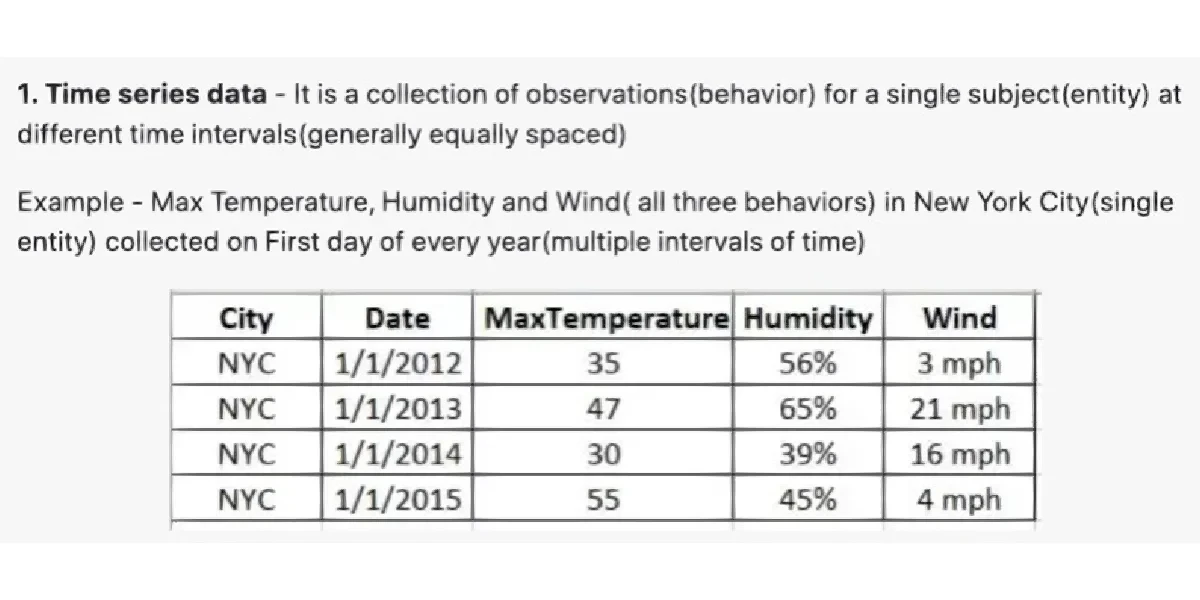
A time series is simply a sequence of data points indexed in time order—such as stock prices, forex rates, or cryptocurrency prices recorded at regular intervals. Time series analysis involves studying these data points to identify patterns, trends, seasonality, and noise, which can then be used to forecast future values or generate trading signals.
Why It Matters for Trading
Financial markets are inherently time-based systems. Every price, volume, or indicator is tied to time, making time series analysis a core foundation of quantitative trading. It helps traders:
- Detect trends (upward or downward).
- Forecast short-term and long-term price movements.
- Identify anomalies that may indicate trading opportunities.
- Reduce emotional decision-making by relying on systematic models.
If you’re new to quant trading, learning why time series analysis is important in quantitative trading will give you the confidence to approach markets with structure rather than guesswork.
Core Components of Time Series Data
- Trend – The long-term direction (e.g., bull or bear market).
- Seasonality – Repetitive patterns tied to time cycles (e.g., intraday volatility spikes).
- Cyclicality – Non-fixed, recurring fluctuations driven by broader market cycles.
- Randomness (Noise) – Irregular fluctuations caused by unpredictable events.
Understanding these elements allows traders to separate signal from noise and design trading systems that adapt to dynamic market conditions.
Two Key Methods for Time Series Analysis in Trading
To make time series analysis actionable for traders, two widely used approaches stand out: statistical modeling (ARIMA, exponential smoothing) and machine learning approaches (LSTM, Random Forests).
1. Statistical Models
How It Works
Statistical models rely on mathematical formulas to explain and predict financial time series. The most common is the ARIMA (AutoRegressive Integrated Moving Average) model, which is effective for short-term forecasting.
Advantages
- Transparent and explainable.
- Require smaller datasets to function effectively.
- Easy to implement with basic programming skills.
Disadvantages
- Limited ability to capture complex non-linear patterns.
- Can underperform in highly volatile environments like crypto.
2. Machine Learning Models
How It Works
Machine learning models, such as Long Short-Term Memory (LSTM) neural networks, use advanced algorithms to learn from historical data and detect non-linear dependencies.
Advantages
- Capture complex, non-linear market dynamics.
- Adaptable to large datasets across multiple markets.
- More accurate forecasting in volatile conditions.
Disadvantages
- Require significant computational resources.
- Can be a “black box,” making interpretation difficult.
- Risk of overfitting if not validated properly.
Comparison of Approaches
| Approach | Best For | Pros | Cons |
|---|---|---|---|
| Statistical Models | Beginners, short-term traders | Easy to implement, interpretable | Limited complexity handling |
| Machine Learning Models | Advanced traders, data scientists | Powerful, non-linear forecasting | Computationally heavy, risk of overfitting |
Recommendation: For novices, start with statistical models to build a foundation, then gradually incorporate machine learning as you gain more expertise.
Practical Applications of Time Series Analysis in Trading
Forecasting Market Prices
Time series models help traders predict future prices with varying confidence levels. This forms the backbone of algorithmic trading strategies.
Volatility Estimation
By analyzing historical volatility patterns, traders can adjust leverage and position sizing dynamically.
Anomaly Detection
Unusual price movements often precede significant events. Detecting anomalies early gives traders an edge in entering or exiting positions.
Strategy Validation
When building strategies, it’s critical to understand how to validate time series models in trading. This includes backtesting on historical data, forward testing in paper accounts, and stress-testing under extreme scenarios.
Where to Apply Time Series Analysis in Quantitative Trading
Traders can apply time series methods across various asset classes:
- Forex: Capturing intraday cycles and liquidity patterns.
- Cryptocurrency: Exploiting high volatility for short-term gains.
- Equities: Long-term forecasting based on macroeconomic cycles.
- Futures and Options: Identifying seasonality and volatility spikes.
Modern brokers and exchanges also provide APIs, making it easier to apply time series models directly into execution systems.
Step-by-Step Framework for Beginners
Collect Data
- Use sources like Yahoo Finance, Quandl, or exchange APIs.
- Ensure consistent time intervals (1m, 5m, daily).
- Use sources like Yahoo Finance, Quandl, or exchange APIs.
Visualize Data
- Plot time series to identify trends and seasonality.
- Tools: Python (Matplotlib, Seaborn), R (ggplot2).
- Plot time series to identify trends and seasonality.
Preprocess Data
- Remove outliers and fill missing values.
- Normalize scales if combining multiple instruments.
- Remove outliers and fill missing values.
Build Models
- Start with ARIMA or exponential smoothing.
- Progress to advanced models like LSTM when comfortable.
- Start with ARIMA or exponential smoothing.
Backtest & Validate
- Run strategies on historical data.
- Check for overfitting and robustness.
- Run strategies on historical data.
Deploy & Monitor
- Start with paper trading.
- Gradually transition to live trading with small capital.
- Start with paper trading.
Visual Example: Time Series Decomposition

A time series broken into trend, seasonality, and residual noise components, essential for trading analysis.
Common Pitfalls for Novice Traders
- Ignoring Seasonality: Many traders mistake seasonal cycles for random noise.
- Overfitting Models: Designing a model that works on past data but fails in real-time.
- Neglecting Risk Management: Even accurate models must be paired with stop-loss and position sizing rules.
- Over-leveraging: Combining high leverage with untested models often leads to catastrophic losses.
FAQ: Novice Guide to Time Series Analysis in Trading
1. Can I use time series analysis without coding skills?
Yes. Platforms like Excel and commercial software (e.g., EViews) allow basic time series modeling. However, learning Python or R significantly expands your capabilities and access to libraries.
2. How do I choose the right model for trading?
Start with simple models like ARIMA for short-term forecasting. As you grow, explore machine learning models for non-linear and multi-variable datasets. Always test multiple models and choose the one with consistent performance.
3. How much historical data do I need for time series analysis?
It depends on your trading timeframe. For intraday scalping, several weeks of tick data may suffice. For long-term investing, years of daily or monthly data are necessary to capture cycles and trends.
Conclusion: Building Confidence with Time Series Analysis
This novice guide to time series analysis in trading shows that with the right tools and methods, traders can move beyond intuition to data-driven decision-making. Starting with statistical models builds a solid foundation, while advancing to machine learning approaches unlocks greater potential.
As you grow, remember that time series is not just about forecasting—it’s about risk control, anomaly detection, and strategy validation. Whether you are learning how to use time series analysis in quantitative trading or exploring how to forecast with time series analysis in trading, consistency and discipline will be your greatest allies.
💬 Join the Discussion
Have you started applying time series analysis in your trading? Which methods worked best for you? Share your thoughts below, and don’t forget to pass this guide to other traders who want to strengthen their quantitative skills.
Would you like me to expand this into a WordPress-ready HTML article (with SEO meta tags, alt texts for images, and schema markup), so you can directly upload it to your site?