
=================================================
Quantitative trading, or quant trading, relies on systematic models and mathematical analysis to identify profitable opportunities in the market. While machine learning, statistics, and factor models dominate this domain, chart patterns—a tool traditionally associated with discretionary traders—have recently found a strong foothold in quantitative strategies. In this article, we’ll explore in depth how to use chart patterns in quantitative trading, compare multiple approaches, examine their pros and cons, and share insights on integrating them into algorithmic workflows.
The Role of Chart Patterns in Quantitative Trading
Chart patterns are recurring formations on price charts that signal potential trend continuations or reversals. Examples include head and shoulders, double tops/bottoms, flags, pennants, and triangles. While once criticized as “subjective,” advancements in data science and pattern recognition have made chart patterns increasingly relevant to quant traders.
Why Quantitative Traders Are Revisiting Chart Patterns
- Data-Driven Validation: Chart patterns can now be backtested across decades of tick-level data.
- Automation: Modern algorithms can scan thousands of assets simultaneously for patterns.
- Hybrid Edge: Combining statistical methods with visual pattern recognition often improves signal accuracy.
For those seeking a broader foundation, see related reading: why chart patterns are important in quant strategies.
Core Principles of Chart Pattern Application
1. Objectivity Through Algorithms
Quant traders rely on deterministic rules to eliminate subjectivity. For instance, a “double top” might be defined by precise parameters such as:
- Two local highs within ±2% price range.
- A retracement between highs of at least 5%.
- Breakout confirmation with volume surge.
2. Statistical Backtesting
A pattern’s validity depends on its historical success rate. Backtesting across multiple markets helps distinguish robust signals from spurious ones.
3. Risk Management Integration
No pattern works 100% of the time. Patterns must be paired with stop-loss rules, position sizing, and portfolio-level diversification.
Two Methods for Using Chart Patterns in Quantitative Trading
Method 1: Rule-Based Pattern Detection
This approach encodes chart pattern definitions into algorithmic rules. For example, a “head and shoulders” pattern is detected using geometric criteria: three peaks with the middle peak higher than the other two, followed by a neckline break.
Advantages:
- Transparent and explainable.
- Easy to backtest and validate.
- Low computational cost.
Disadvantages:
- Limited adaptability—patterns may evolve with market conditions.
- Requires precise definitions, which can exclude near-pattern formations.
Method 2: Machine Learning-Based Recognition
Here, quants use convolutional neural networks (CNNs) or recurrent neural networks (RNNs) to train models that “see” patterns like humans do. Models are trained on millions of labeled chart images or synthetic data.
Advantages:
- Captures subtle variations in chart patterns.
- Can adapt to new market dynamics.
- Higher predictive accuracy in volatile conditions.
Disadvantages:
- Computationally expensive.
- Less transparent (“black box” problem).
- Requires large, well-labeled datasets.
Which Method Is Best?
While machine learning delivers superior adaptability, rule-based systems are easier to explain and regulate. In practice, many successful quant firms blend both: using machine learning for detection and rule-based filters for confirmation.
Popular Chart Patterns in Quant Trading
Trend Continuation Patterns
- Flags and Pennants: Short pauses before strong moves.
- Triangles: Breakouts after consolidation.
Reversal Patterns
- Head and Shoulders: Trend reversal signal.
- Double Tops/Bottoms: Indicate exhaustion of momentum.
Complex and Rare Patterns
- Cup and Handle: Bullish continuation pattern.
- Broadening Formations: Indicate increasing volatility.
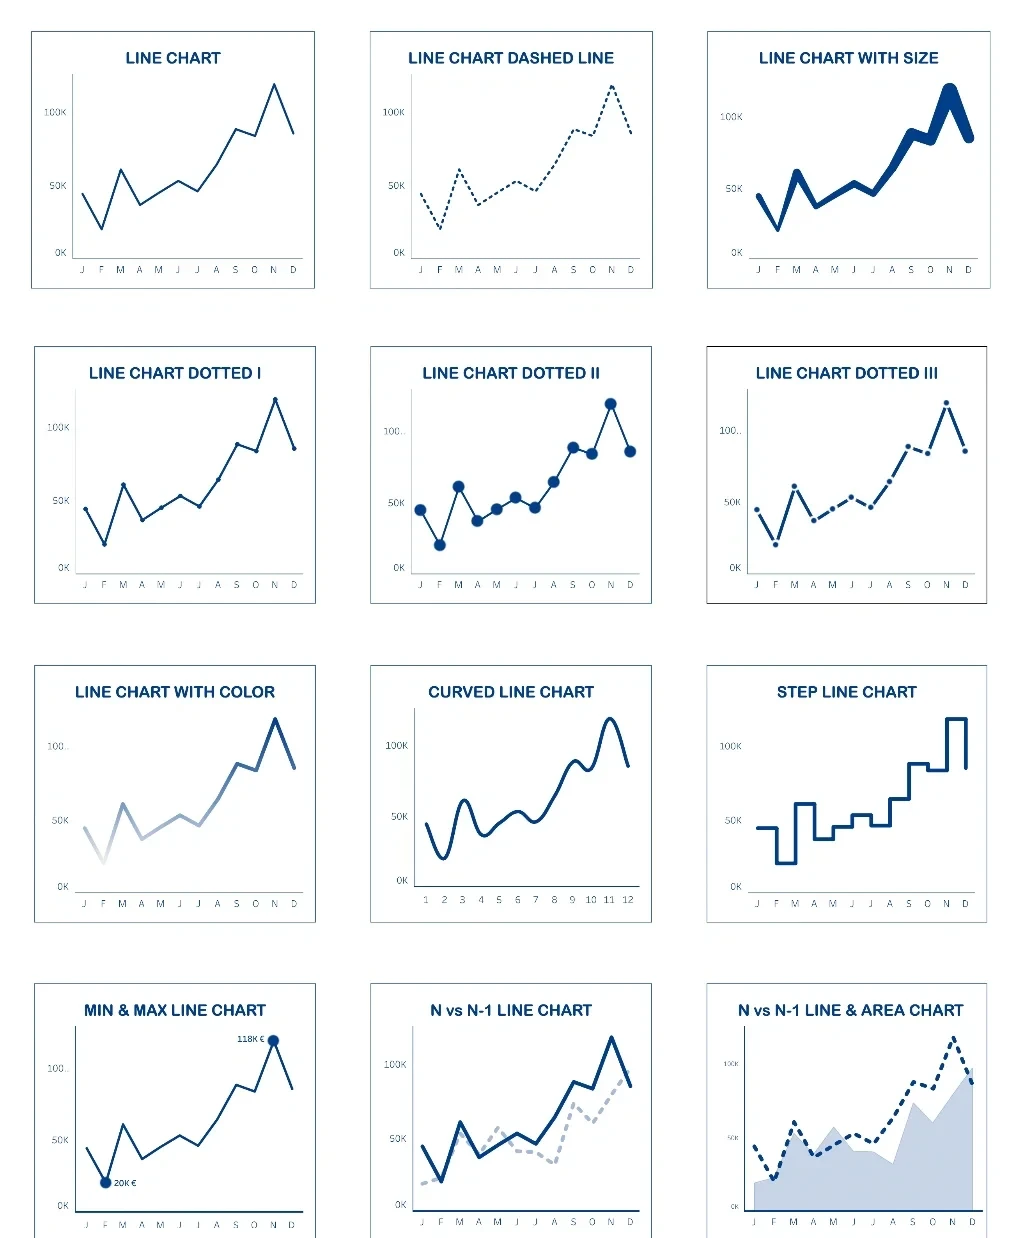
Examples of classical chart patterns used in quantitative trading
How to Backtest Chart Patterns in Quantitative Trading
Step 1: Define Objective Criteria
Each pattern must be encoded into mathematical conditions.
Step 2: Collect Historical Data
Use tick-level or OHLCV (open-high-low-close-volume) data.
Step 3: Run Statistical Tests
Measure:
- Win rate.
- Average return per trade.
- Maximum drawdown.
- Sharpe ratio.
Step 4: Optimize Parameters
Adjust pattern definitions (e.g., tolerance levels, breakout confirmations) to improve robustness.
Real-World Application: Chart Patterns in Algorithmic Trading Systems
Use Case 1: High-Frequency Trading (HFT)
HFT algorithms scan for micro-patterns such as order book imbalances or intraday flag formations. These strategies require ultra-low latency.
Use Case 2: Swing Trading Models
Quantitative swing trading systems rely on larger patterns like triangles and double bottoms, combined with momentum filters.
Use Case 3: Cross-Asset Analysis
Patterns applied across equities, forex, crypto, and commodities can highlight universal behavioral biases in markets.
For more insights on multi-asset approaches, check out: chart patterns for algorithmic trading systems.
Chart Patterns and Market Conditions
Bull Markets
Patterns like ascending triangles and cup-and-handle often yield stronger breakout moves.
Bear Markets
Bearish head and shoulders and descending triangles become more predictive. Understanding how chart patterns work in bear markets helps traders avoid misinterpretation.
Best Practices for Using Chart Patterns in Quant Trading
- Combine With Indicators: Use RSI, MACD, or moving averages to confirm signals.
- Account for Regime Shifts: Patterns may behave differently in volatile vs. stable periods.
- Automate Detection: Avoid manual bias by relying on software or machine learning.
- Risk Control First: Treat chart patterns as probabilistic, not deterministic.
Frequently Asked Questions (FAQ)
1. Can chart patterns really be quantified?
Yes. Patterns like double tops can be expressed in precise rules (e.g., highs within 2% range, neckline support levels). This removes subjectivity and makes them suitable for algorithmic trading.
2. Do chart patterns work in crypto markets?
Yes, but with higher volatility. Patterns like flags and triangles are common in Bitcoin and Ethereum. Quants should use tighter risk controls when applying these strategies to crypto.
3. Why do chart patterns sometimes fail?
Patterns fail when markets experience unexpected macro shocks, high-frequency distortions, or low liquidity. This is why robust risk management and confirmation signals are essential.
Final Thoughts
Learning how to use chart patterns in quantitative trading can give traders a unique edge by blending classical technical analysis with modern data science. While no pattern is foolproof, the integration of algorithmic detection, backtesting, and risk controls makes them a powerful addition to quantitative strategies.
If this guide gave you valuable insights, consider sharing it on social media or discussing it with your trading network. What chart pattern has worked best in your experience? Drop your thoughts in the comments below—we’d love to hear from you!
Would you like me to also prepare a Python backtest template for quantifying chart patterns (e.g., double tops or head and shoulders) so you can apply these concepts directly in your trading systems?
0 Comments
Leave a Comment