===========================================
Volatility forecasting is one of the most important aspects of quantitative trading. Without accurate volatility models, risk management, position sizing, and derivative pricing can fail. Among the most popular models for volatility is GARCH (Generalized Autoregressive Conditional Heteroskedasticity). For newcomers in the field, understanding GARCH may seem intimidating, but once broken down, it becomes a powerful tool for building robust trading strategies.
This article offers a comprehensive beginner’s guide to GARCH for quantitative trading, covering fundamentals, applications, implementation methods, comparisons with other approaches, and practical advice based on real-world experience.
What Is GARCH in Quantitative Trading?
GARCH is a statistical model used to forecast financial market volatility. Unlike simple variance estimators, GARCH adapts dynamically: it assumes today’s volatility depends on past volatility and past shocks (market returns).
In plain terms:
- When markets are calm, GARCH predicts lower volatility.
- When markets are turbulent, GARCH raises volatility estimates.
For traders, this matters because volatility impacts:
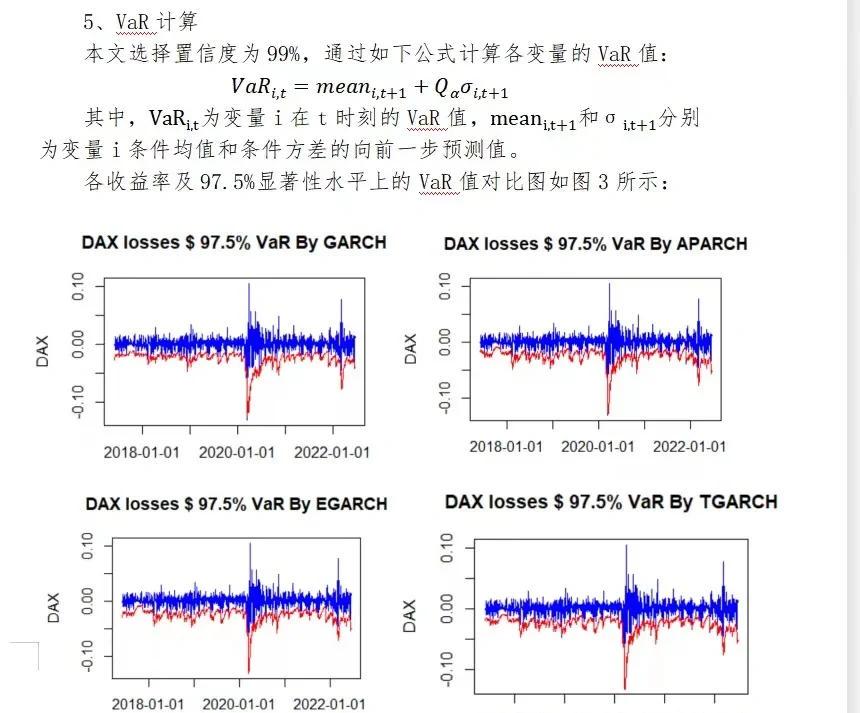
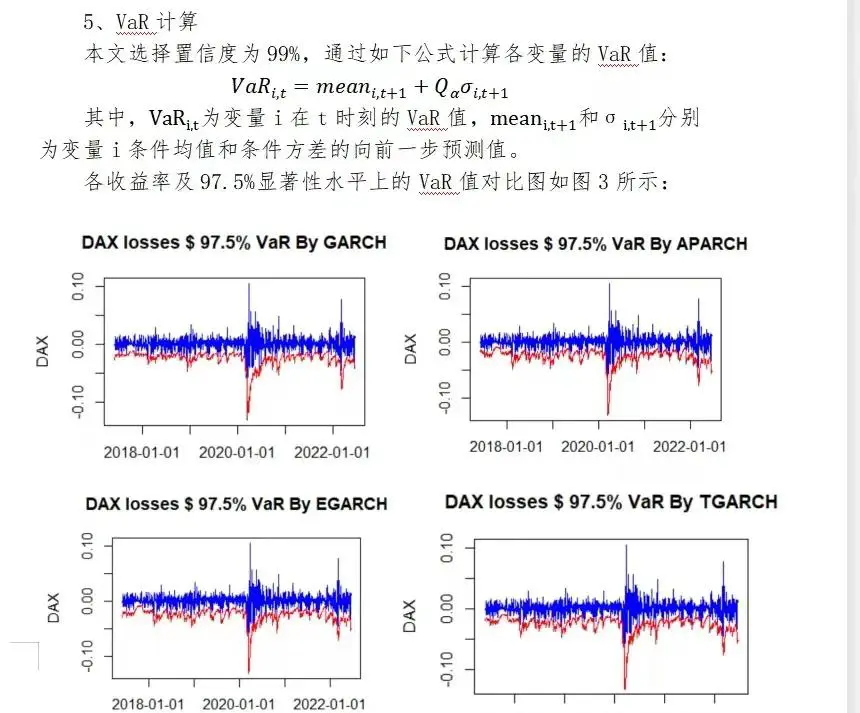
- Risk management (Value-at-Risk, stop-loss placement)
- Position sizing (allocating capital based on expected risk)
- Derivatives pricing (options depend heavily on volatility forecasts)
- Trading signals (volatility clustering can indicate regime shifts)
GARCH models capture volatility clustering—periods of calm followed by turbulence.

Why Beginners Should Learn GARCH
- Practical Relevance: Volatility is at the core of trading risk and return.
- Broad Applications: From equities to FX, crypto, and commodities, GARCH models are widely used.
- Model Flexibility: Extensions (EGARCH, TGARCH) handle asymmetry and leverage effects.
- Quantitative Career Advantage: GARCH is a core concept tested in quantitative finance interviews and used in hedge funds, prop trading, and academic research.
The Basic GARCH(1,1) Model Explained
The simplest and most widely used form is GARCH(1,1):
σt2=α0+α1ϵt−12+β1σt−12\sigma_t^2 = \alpha_0 + \alpha_1 \epsilon_{t-1}^2 + \beta_1 \sigma_{t-1}^2σt2=α0+α1ϵt−12+β1σt−12
Where:
- σt2\sigma_t^2σt2: Forecasted variance at time ttt
- α0\alpha_0α0: Constant term
- α1\alpha_1α1: Sensitivity to last period’s shock
- β1\beta_1β1: Persistence of past volatility
- ϵt−1\epsilon_{t-1}ϵt−1: Previous error (return shock)
Interpretation for traders:
- If markets experience a shock (e.g., a crash), volatility spikes and stays elevated for some time.
- If markets are calm, volatility declines gradually.
Two Key Methods to Apply GARCH in Trading
1. GARCH for Volatility Forecasting and Risk Management
Traders use GARCH to forecast future volatility and adjust position sizes accordingly. For instance:
- In high-volatility regimes, reduce exposure.
- In low-volatility regimes, increase exposure.
Pros:
- Improves capital preservation.
- Useful for Value-at-Risk (VaR) calculations.
Cons:
- GARCH assumes volatility clustering, which may break in unprecedented events (e.g., COVID-19 crash).
- Sensitive to parameter estimation.
2. GARCH for Trading Signals and Derivative Pricing
Options traders often use GARCH to improve implied volatility surfaces or identify mispriced contracts. In directional trading, GARCH can signal regime changes: when volatility spikes, mean-reversion or breakout strategies may activate.
Pros:
- Helps exploit volatility mispricing.
- Enhances options trading strategies.
Cons:
- Requires deeper mathematical background.
- More effective in liquid markets with rich options data.

GARCH output is often used to compare predicted vs. realized volatility for strategy refinement.
GARCH vs. Alternative Volatility Models
| Model | Strengths | Weaknesses |
|---|---|---|
| Historical Volatility | Simple, intuitive, no parameters | Ignores volatility clustering, not forward-looking |
| Exponential Weighted Moving Average (EWMA) | Weights recent data more | Less flexible than GARCH |
| GARCH(1,1) | Captures clustering, adaptable | Assumes linear persistence, may fail in extreme cases |
| Stochastic Volatility Models | More realistic | Computationally heavy, less beginner-friendly |
Recommendation:
- For beginners: Start with GARCH(1,1) due to its balance of accuracy and simplicity.
- For advanced use: Explore EGARCH (handles asymmetry) or GJR-GARCH (accounts for leverage effects).

Practical Implementation for Beginners
Step 1: Data Preparation
- Collect daily returns (log returns preferred).
- Remove anomalies and missing values.
Step 2: Fit a GARCH Model
- Use libraries like
archin Python orrugarchin R.
Step 3: Forecast Volatility
- Generate one-step-ahead volatility forecasts.
- Compare with realized volatility to validate.
Step 4: Apply to Strategy
- Adjust leverage, stop-loss, or option pricing.
For hands-on learners, tutorials on how to implement GARCH in Python for trading provide step-by-step coding guides.
Best Practices for Using GARCH in Quantitative Trading
- Always Backtest
Forecasting power varies across assets. Testing on historical data is crucial. (See also: how to backtest GARCH trading models.)
- Don’t Overfit Parameters
Stick to GARCH(1,1) before moving to higher-order models.
- Combine with Other Indicators
GARCH alone won’t guarantee profitability; combine it with trend, volume, or fundamental signals.
- Account for Regime Shifts
During black swan events, GARCH forecasts may underestimate risk.
- Use Rolling Windows
Update parameters regularly to reflect new market conditions.
Common Pitfalls Beginners Face
- Misinterpreting volatility as direction: GARCH predicts magnitude, not direction.
- Over-reliance on models: Models are approximations; always layer human judgment.
- Neglecting tail risks: Extreme moves often break GARCH assumptions.
Future of GARCH in Trading
- Integration with Machine Learning: Hybrid GARCH-ML models improve adaptability.
- Crypto Market Applications: Given high volatility, GARCH is increasingly used in crypto risk management.
- Real-Time Forecasting: With faster computing, intraday GARCH forecasting is becoming viable.

FAQ: GARCH for Beginners in Quantitative Trading
1. Can GARCH models predict market crashes?
Not directly. GARCH forecasts volatility clustering but cannot predict sudden crashes. However, it may capture post-crash volatility persistence.
2. How much data do I need for a reliable GARCH model?
At least 500–1000 daily observations are recommended. Shorter series may lead to unstable parameter estimates.
3. Is GARCH better for equities, FX, or crypto?
It works across all asset classes but tends to perform better in markets with strong volatility clustering, such as FX and crypto.
Conclusion
For beginners, mastering GARCH in quantitative trading provides a strong foundation in volatility forecasting and risk management. While not a silver bullet, GARCH is a proven and practical tool for both academic research and real-world trading strategies.
By starting with GARCH(1,1), learning how to interpret results, and combining insights with other trading tools, beginners can steadily build robust volatility-based strategies.
Have you experimented with GARCH models in your trading journey? Share your experiences in the comments and spread this guide with fellow traders to help them start their quantitative journey.
Would you like me to create a step-by-step Python notebook that walks through fitting a GARCH(1,1) model on real market data for beginners?

0 Comments
Leave a Comment