====================================================
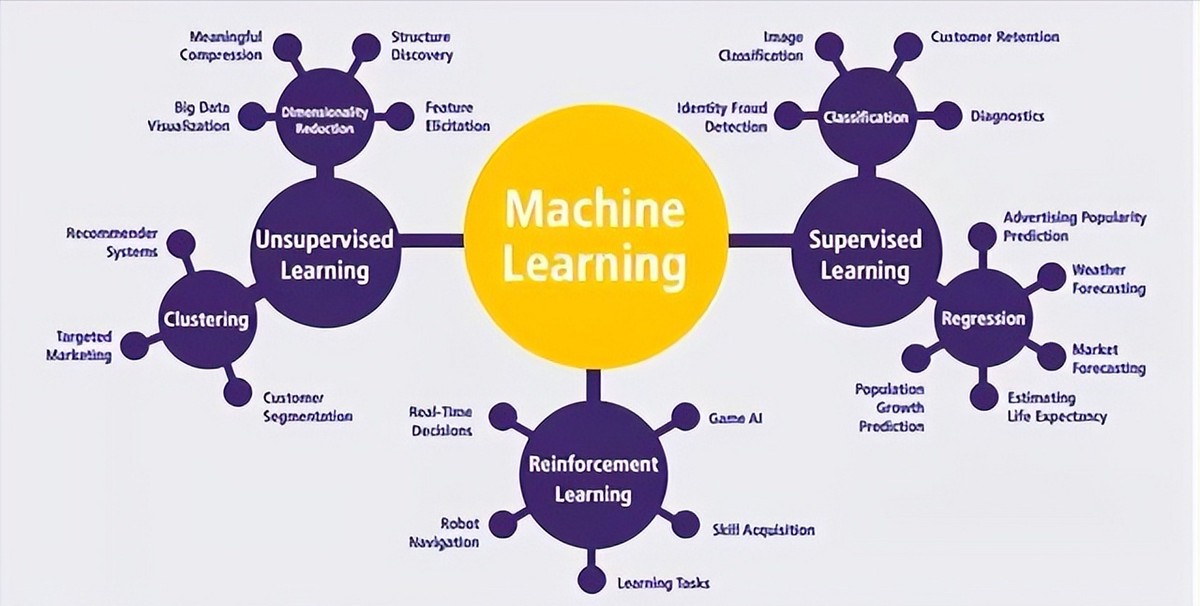
Machine learning (ML) has revolutionized the trading landscape, enabling traders to develop predictive models, automate decision-making, and gain a competitive edge in financial markets. Among the many tools available, R programming stands out for its extensive statistical capabilities, rich ecosystem of financial packages, and strong community support. This comprehensive guide explores how to implement machine learning with R in trading, covering step-by-step workflows, real-world strategies, and practical insights for traders and quantitative analysts.
Why Use R for Machine Learning in Trading?
R is a leading language for statistical computing and financial modeling. Its powerful libraries make it ideal for implementing advanced trading strategies based on machine learning. Here’s why R is a top choice for traders:
- Extensive ML and statistical packages: Packages like
caret,xgboost, andrandomForestprovide a complete suite for predictive modeling.
- Superior data visualization: Libraries such as
ggplot2enable traders to visualize market patterns and backtest results effectively.
- Financial ecosystem: R integrates seamlessly with packages like
quantmod,TTR, andPerformanceAnalyticsfor trading-specific tasks.
- Community and resources: R offers abundant tutorials, courses, and user-contributed packages for quantitative finance.
If you are new to R for trading, you can explore resources such as How to use R for quantitative trading? or How R helps in backtesting trading models? to get started.

Step-by-Step Guide: Implementing Machine Learning with R in Trading
The process of applying machine learning in trading using R can be broken down into clear, actionable steps.
1. Data Collection and Preprocessing
Before building any ML model, traders need high-quality market data.
- Data sources: Use APIs like
quantmod, Yahoo Finance, or Quandl to obtain historical price, volume, and macroeconomic data.
- Cleaning data: Handle missing values, remove outliers, and align different time series.
- Feature engineering: Create technical indicators such as moving averages, RSI, or MACD using packages like
TTR.
Example in R:
R


Copy code


library(quantmod)
getSymbols("AAPL", src = "yahoo", from = "2018-01-01", to = "2023-01-01")
apple_data <- na.omit(Cl(AAPL))
Data preprocessing in R is critical for ensuring the accuracy of machine learning models.

0 Comments
Leave a Comment