
======================================================
In trading, risk management is crucial to safeguarding profits and minimizing losses. One of the most important statistical tools for assessing risk is the standard deviation. Standard deviation measures the volatility or dispersion of returns in a given dataset, making it an essential metric for traders in both quantitative and traditional trading strategies. Understanding how standard deviation affects trading risk management can lead to more informed decision-making and better risk mitigation.
This article will explore the role of standard deviation in trading risk management, review different methods of incorporating it into trading strategies, and provide actionable insights for improving trading practices. By the end, readers will have a deeper understanding of how to use standard deviation to manage risk and enhance trading performance.
What is Standard Deviation in Trading?
Definition and Importance
Standard deviation is a statistical measure that indicates the degree of variation or dispersion of a set of values. In trading, it is used to quantify the volatility of an asset’s price over a specific period of time. A higher standard deviation implies greater price volatility, indicating a higher risk of significant price fluctuations. Conversely, a lower standard deviation suggests more stability in price movements.
By incorporating standard deviation into trading strategies, traders can assess potential price volatility and adjust their risk management techniques accordingly. Understanding the relationship between standard deviation and risk is crucial for building effective trading plans.
How Standard Deviation Relates to Risk Management
In risk management, standard deviation helps traders understand the potential range of returns for a particular asset or trading strategy. By calculating the standard deviation of past price movements, traders can estimate the likelihood of future price changes and identify the risk level associated with a trade.
Risk management strategies based on standard deviation include:
- Position Sizing: Traders adjust the size of their positions based on the level of volatility (standard deviation) in the market. Higher volatility warrants smaller position sizes to mitigate risk.
- Stop-Loss and Take-Profit Levels: Standard deviation can be used to set appropriate stop-loss and take-profit levels. For example, a trader may set a stop-loss at a distance from the entry point equal to 1.5 times the standard deviation to limit potential losses.
- Risk-Reward Ratio: Standard deviation is also integral to calculating an optimal risk-reward ratio, helping traders assess whether the potential reward justifies the risk.
Methods of Using Standard Deviation for Risk Management
1. Standard Deviation in Volatility-Based Trading Strategies
Volatility-based strategies use standard deviation to identify periods of high or low market volatility. By monitoring volatility, traders can adapt their trading approaches accordingly.
Advantages:
- Dynamic Risk Adjustment: Volatility-based strategies adjust risk exposure based on the current market conditions, making them highly adaptable.
- Objective Decision-Making: Using standard deviation removes emotions from the decision-making process, as traders can rely on data-driven metrics.
Disadvantages:
- Increased Complexity: Volatility-based strategies require more frequent adjustments and calculations, which can complicate the trading process.
- False Signals: In highly volatile markets, standard deviation-based strategies may generate frequent buy and sell signals that could lead to unnecessary trades.
2. Using Standard Deviation to Calculate Expected Returns and Risk
Another approach to incorporating standard deviation in risk management is by calculating the expected return of a trading strategy while considering risk. The idea is to calculate the standard deviation of returns over a period and then assess the expected risk-adjusted returns.
This method is useful for traders who want to optimize their portfolio by balancing both risk and return. For example, calculating the Sharpe ratio involves the standard deviation of returns to measure risk-adjusted performance.
Advantages:
- Comprehensive Risk Assessment: By calculating the expected risk-adjusted return, traders gain a better understanding of how much risk they are taking to achieve potential gains.
- Portfolio Optimization: This method allows for better diversification by identifying assets with varying levels of volatility, leading to a more balanced portfolio.
Disadvantages:
- Requires Historical Data: The accuracy of this method depends heavily on the availability of historical price data, which may not always be reliable or representative of future price movements.
- Risk of Overfitting: Focusing too much on past data may result in overfitting the strategy to historical patterns, which may not hold true in the future.
How to Calculate Standard Deviation in Quantitative Trading
To effectively use standard deviation in trading risk management, traders need to understand how to calculate it. The formula for standard deviation is as follows:
σ=1N∑i=1N(xi−μ)2\sigma = \sqrt{\frac{1}{N}\sum_{i=1}^{N}(x_i - \mu)^2}σ=N1i=1∑N(xi−μ)2
Where:
- σ\sigmaσ is the standard deviation
- NNN is the number of data points
- xix_ixi is each data point
- μ\muμ is the mean of the dataset
In quantitative trading, this calculation can be performed on a variety of data points, such as historical asset prices or returns, to assess the volatility and potential risk involved.
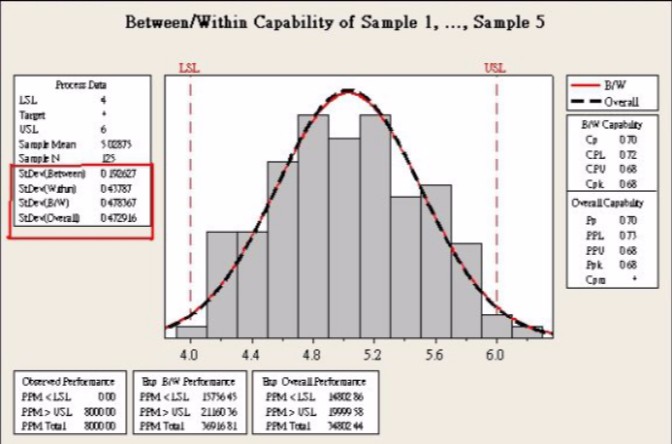
Visualizing the Role of Standard Deviation in Risk Management
This chart illustrates how price volatility increases as standard deviation rises, highlighting the increased risk.
FAQ: Frequently Asked Questions
1. How does standard deviation help manage risk in trading?
Standard deviation helps traders assess how much an asset’s price fluctuates, which is critical for determining the risk of a trade. A higher standard deviation indicates greater volatility, which can lead to larger price swings and higher risk. By using standard deviation, traders can adjust their position sizes, stop-loss levels, and other risk management techniques to account for these fluctuations.
2. Can standard deviation be used for all trading strategies?
While standard deviation is a valuable tool, it may not be suitable for every trading strategy. For example, in trend-following strategies, traders may rely more on moving averages or momentum indicators. However, for strategies focused on volatility and risk assessment, standard deviation is an indispensable metric.
3. What is the difference between standard deviation and volatility?
Volatility and standard deviation are closely related but not identical. Volatility generally refers to the degree of variation in an asset’s price over time, while standard deviation is a specific statistical measure that quantifies this variation. In trading, volatility often refers to the market’s overall price movement, while standard deviation is used to calculate the variability of individual assets or returns.
Conclusion
Understanding how standard deviation affects trading risk management is essential for any trader looking to optimize their trading strategy. By calculating and analyzing standard deviation, traders can make more informed decisions, minimize risks, and improve their chances of long-term success. Whether you are using volatility-based strategies or calculating risk-adjusted returns, incorporating standard deviation into your risk management toolkit is a step toward smarter, more calculated trading.
Feel free to share this article with other traders or leave a comment below with your thoughts on how you use standard deviation in your trading strategy!
0 Comments
Leave a Comment