================================================
In the world of algorithmic trading, where speed, precision, and data-driven decision-making are critical, the ability to visualize complex financial data is a competitive advantage. Data visualization tools for algorithmic traders transform raw numbers into actionable insights, allowing traders to identify patterns, backtest strategies, and manage risk effectively. This article explores the most powerful tools and methods available, compares their strengths and weaknesses, and highlights how traders can leverage them to maximize profits.
Why Data Visualization Matters in Algorithmic Trading
Algorithmic traders often deal with vast amounts of market data: price feeds, order book depth, execution latency, volatility metrics, and historical time series. Without visualization, this data becomes overwhelming.
Key Benefits of Data Visualization in Trading
- Pattern Recognition: Traders can quickly spot trends, correlations, or anomalies that would be invisible in raw data.
- Performance Monitoring: Visual dashboards track algorithm performance, execution quality, and slippage in real time.
- Risk Management: Heatmaps, volatility plots, and stress test visualizations help traders understand portfolio exposure.
- Communication: For hedge funds or institutional investors, visual reports simplify complex algorithmic strategies for stakeholders.
Visualization is not just about aesthetics—it is a core tool for faster and better trading decisions.
Types of Data Visualization Tools for Algorithmic Traders
1. Python-Based Libraries (Matplotlib, Plotly, Seaborn)
Python dominates quantitative finance, and its visualization libraries are essential for traders building custom strategies.
Features
- Matplotlib: The foundation of most Python visualizations, great for static charts like candlesticks or moving averages.
- Seaborn: Adds statistical visualizations like correlation matrices, ideal for factor analysis.
- Plotly: Enables interactive dashboards, real-time charts, and drill-down analytics for algorithmic performance.
Advantages
- Flexibility: Fully customizable to any trading system.
- Integration: Works seamlessly with pandas, NumPy, and machine learning libraries.
- Community Support: Large ecosystem with ready-to-use financial chart templates.
Disadvantages
- Learning Curve: Requires coding knowledge, which may limit accessibility for beginners.
- Time-Consuming: Custom dashboard development takes longer compared to plug-and-play platforms.
2. Trading Platforms with Built-In Visualization (MetaTrader, NinjaTrader, TradingView)
Professional trading platforms integrate execution with visualization, giving traders everything in one place.
Features
- MetaTrader 4⁄5: Offers customizable technical indicators, automated trading (Expert Advisors), and advanced charting.
- NinjaTrader: Known for futures and options trading with powerful backtesting visualization tools.
- TradingView: Cloud-based with highly interactive, shareable charts and a vast library of community indicators.
Advantages
- Ease of Use: No coding required, ideal for traders who prioritize execution speed.
- Community Insights: Platforms like TradingView allow sharing custom charts and scripts.
- Real-Time Feeds: Direct integration with brokers and exchanges.
Disadvantages
- Less Customization: Limited compared to Python or R libraries.
- Subscription Costs: Premium features require paid plans.
- Performance Constraints: Web-based platforms can lag during volatile trading periods.
3. Business Intelligence (BI) Tools (Tableau, Power BI, QlikView)
Business intelligence tools are gaining traction among professional and institutional traders for portfolio-level visualization.
Features
- Tableau: Highly interactive dashboards, great for aggregating market and fundamental data.
- Power BI: Strong integration with Excel and Microsoft ecosystem, making it efficient for quick reporting.
- QlikView: Advanced data modeling and associative analytics, suitable for hedge funds with complex portfolios.
Advantages
- Scalability: Handles large datasets across multiple asset classes.
- Cross-Department Use: Useful for risk, compliance, and portfolio managers beyond traders.
- Visual Storytelling: Simplifies communication with stakeholders and investors.
Disadvantages
- High Cost: Enterprise licenses can be expensive.
- Latency: Not built for millisecond-level algorithmic trading decisions.
- Setup Complexity: Requires data pipelines and integration work.
4. Custom Data Visualization Dashboards
For hedge funds, prop trading firms, or advanced individual traders, custom dashboards built with frameworks like Dash (Python), Shiny ®, or D3.js offer ultimate flexibility.
Features
- Real-Time Data Feeds: Integration with APIs for streaming market data.
- Custom KPIs: Traders define metrics like execution slippage, Sharpe ratio, or algorithm runtime efficiency.
- Interactive Dashboards: Drill down into asset performance, portfolio heatmaps, or machine learning predictions.
Advantages
- Tailored Solutions: 100% aligned with trading needs.
- Scalable: Can expand as strategy complexity grows.
- Advanced Analytics: Supports AI and predictive modeling for trading.
Disadvantages
- High Development Cost: Requires programming and data engineering expertise.
- Maintenance: Dashboards need constant updates as strategies evolve.
Comparing Data Visualization Tools for Algorithmic Traders
| Tool Type | Best For | Advantages | Disadvantages |
|---|---|---|---|
| Python Libraries | Quantitative analysts | Flexible, integrates with ML | Coding skills required |
| Trading Platforms | Retail & semi-pro traders | Easy setup, broker integration | Limited customization |
| BI Tools | Institutional investors | Scalable, strong dashboards | High cost, latency issues |
| Custom Dashboards | Professional firms | Tailored solutions, advanced analytics | Expensive, requires expertise |

Practical Application: Choosing the Right Visualization Strategy
Based on my own experience as a quantitative trading consultant, I recommend the following:
- Beginners: Start with TradingView or MetaTrader for quick charting.
- Intermediate Traders: Move into Python libraries for custom strategies.
- Institutional Traders: Adopt BI tools and custom dashboards for portfolio-level insights.
For example, when explaining to junior traders how to use data visualization in quantitative trading, I often show them how a simple correlation heatmap in Seaborn can reveal diversification benefits in a portfolio more effectively than raw correlation tables. Similarly, institutional clients often ask where to find best tools for data visualization in trading, and my advice usually points toward Tableau or Dash for their scalability.

FAQ: Data Visualization Tools for Algorithmic Traders
1. What’s the most beginner-friendly data visualization tool for traders?
For beginners, TradingView is the best option. It offers pre-built indicators, user-friendly charting, and a large community for learning. No programming is required, making it ideal for retail traders.
2. How does data visualization improve trading decision making?
Visualization transforms complex datasets into actionable insights. For example, heatmaps can reveal portfolio concentration risks, while candlestick overlays with moving averages can show trend reversals more clearly than raw price lists.
3. Are Python-based tools better than BI tools for traders?
It depends on your use case. Python tools excel in algorithmic customization and backtesting, while BI tools shine at portfolio-level reporting for institutions. Many firms actually combine both for maximum efficiency.

Final Thoughts
Data visualization tools for algorithmic traders are no longer optional—they are essential for success in today’s data-heavy financial markets. From Python libraries to BI platforms and custom dashboards, each option comes with unique benefits. Traders should choose their tools based on experience level, capital size, and trading objectives.
If you found this guide helpful, share it with your trading community, comment with your favorite visualization tools, and help others enhance their trading workflows with powerful visuals.
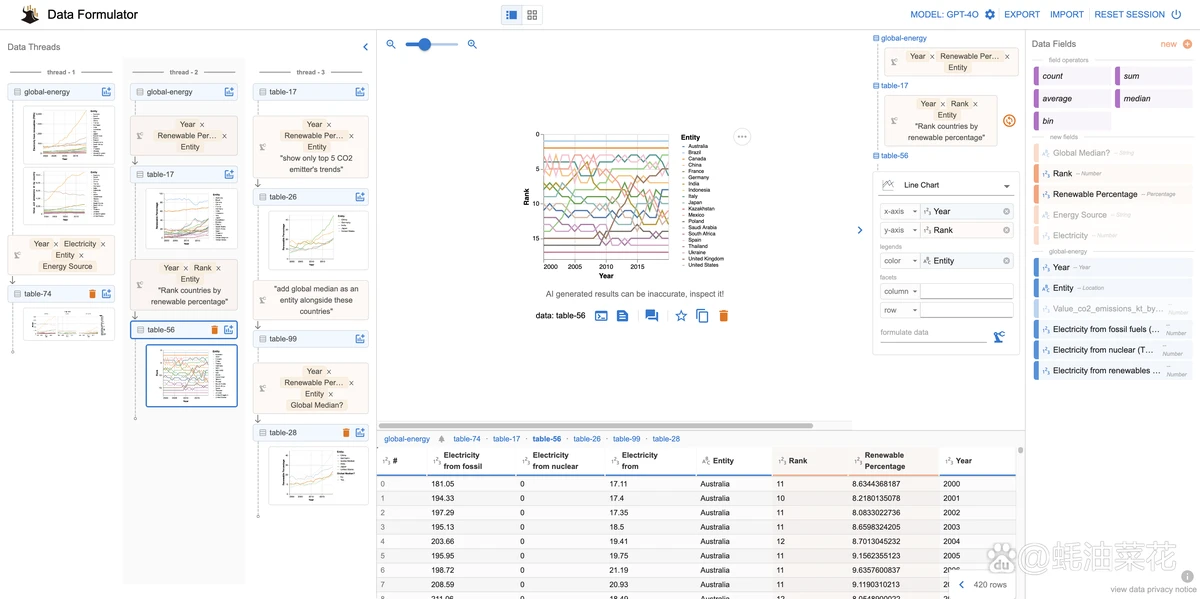
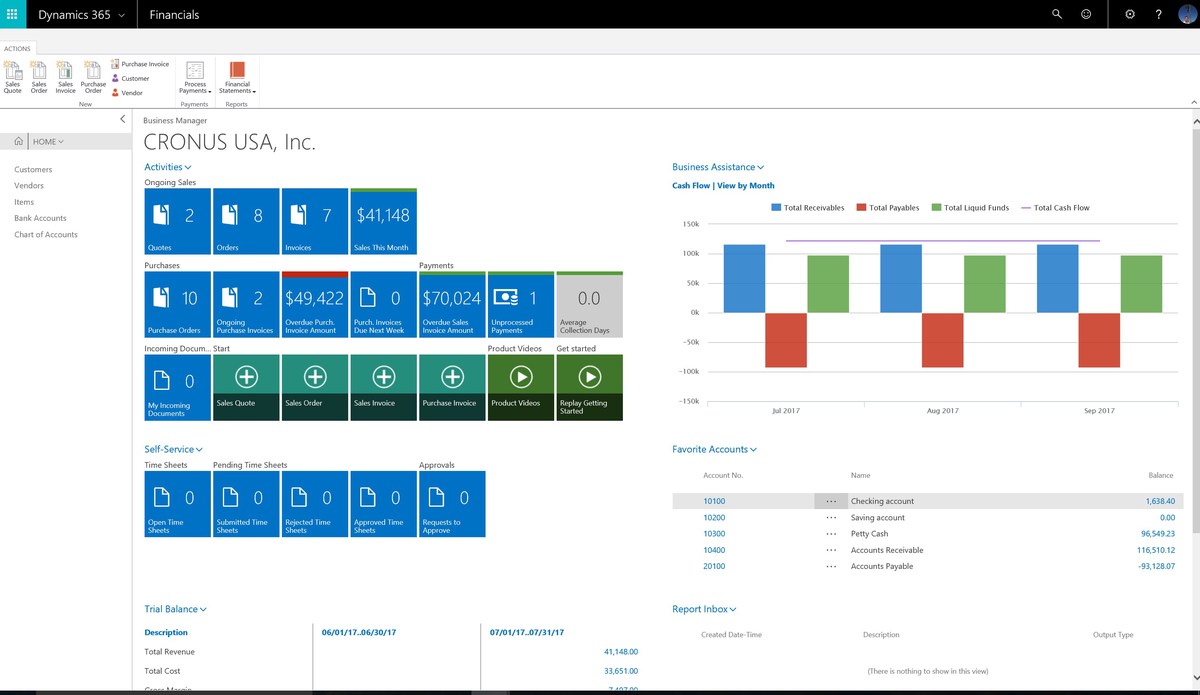
Algorithmic trading data visualization dashboard

0 Comments
Leave a Comment